Infographics Integrations
If you want a ready-made solution for narrowcasting, our infographic controller is the solution par excellence.
With an infographic controller you can easily present energy data (energy production, consumption, water consumption or a production process or schedule) on a TV screen at the entrance, for example. You can also take care of TV yourself, whereby we make a connection with our infographic controller via HMDI.
The data to be presented can be delivered locally via various communication protocols, or we can retrieve the data remotely via Eniris Insights.
Hardware Requirements:
https://wiki.eniris.be/wiki/publicinformation/view/Hardware%20requirements%20infographics/
Calculations:
- Annual CO2 savings (kg) = production (kWh) * 0.2002
- CO2 absorption per tree per year is 30 kg
- An average family uses 3500kWh/year
- Average electric car consumes 2400 kWh/year.
An example:
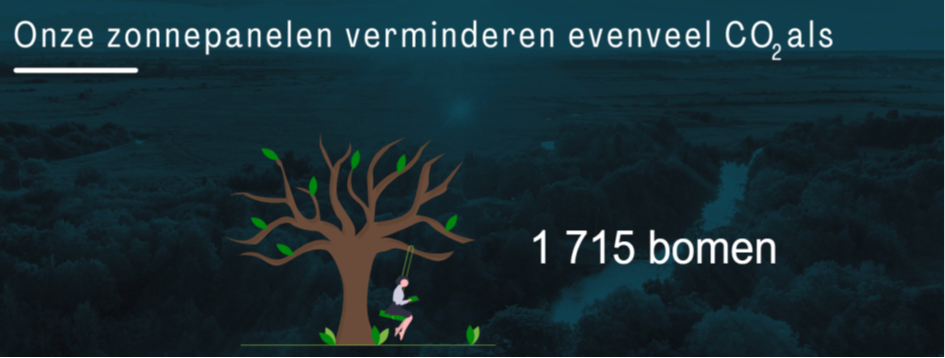
A tree has an intake of 30 kg per year.
For example, the solar installation has produced 72,000kWh in the past 102 days.
Then we extrapolate for one year: 72,000kWh/102*365= 257,000kWh
1 kg CO2 = 0.2002*production (kWh)
=> 51,580 kg/year
1 tree absorbs 30 kg per year:
=> 1,715 trees

1 family needs about 3,500kWh/year
257,000kWh/3,500kWh/year = 73
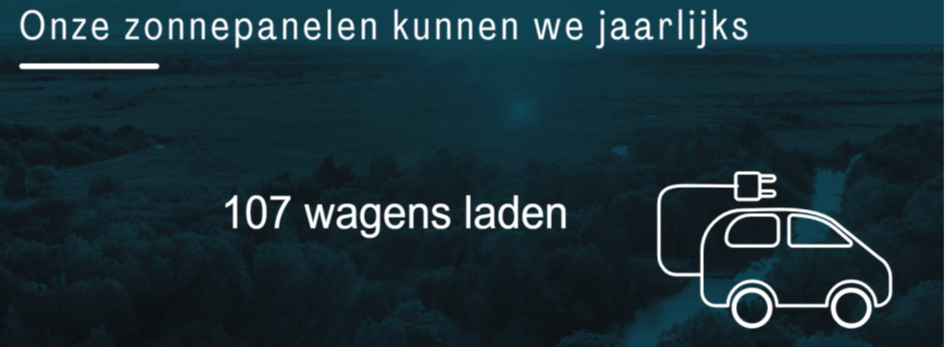
1 car is approximately 2,400kWh/year
257,000kWh/2,400kWh/year = 10

1kg of coal is approximately 7.5kWh of energy.